Connection management
Using your connections resourcefully
Connections
Every Compute Add-On has a pre-configured direct connection count and Supavisor pool size. This guide discusses ways to observe and manage them resourcefully.
Configuring Supavisor's pool size
You can change how many database connections Supavisor can manage by altering the pool size in the "Connection pooling configuration" section of the Database Settings:
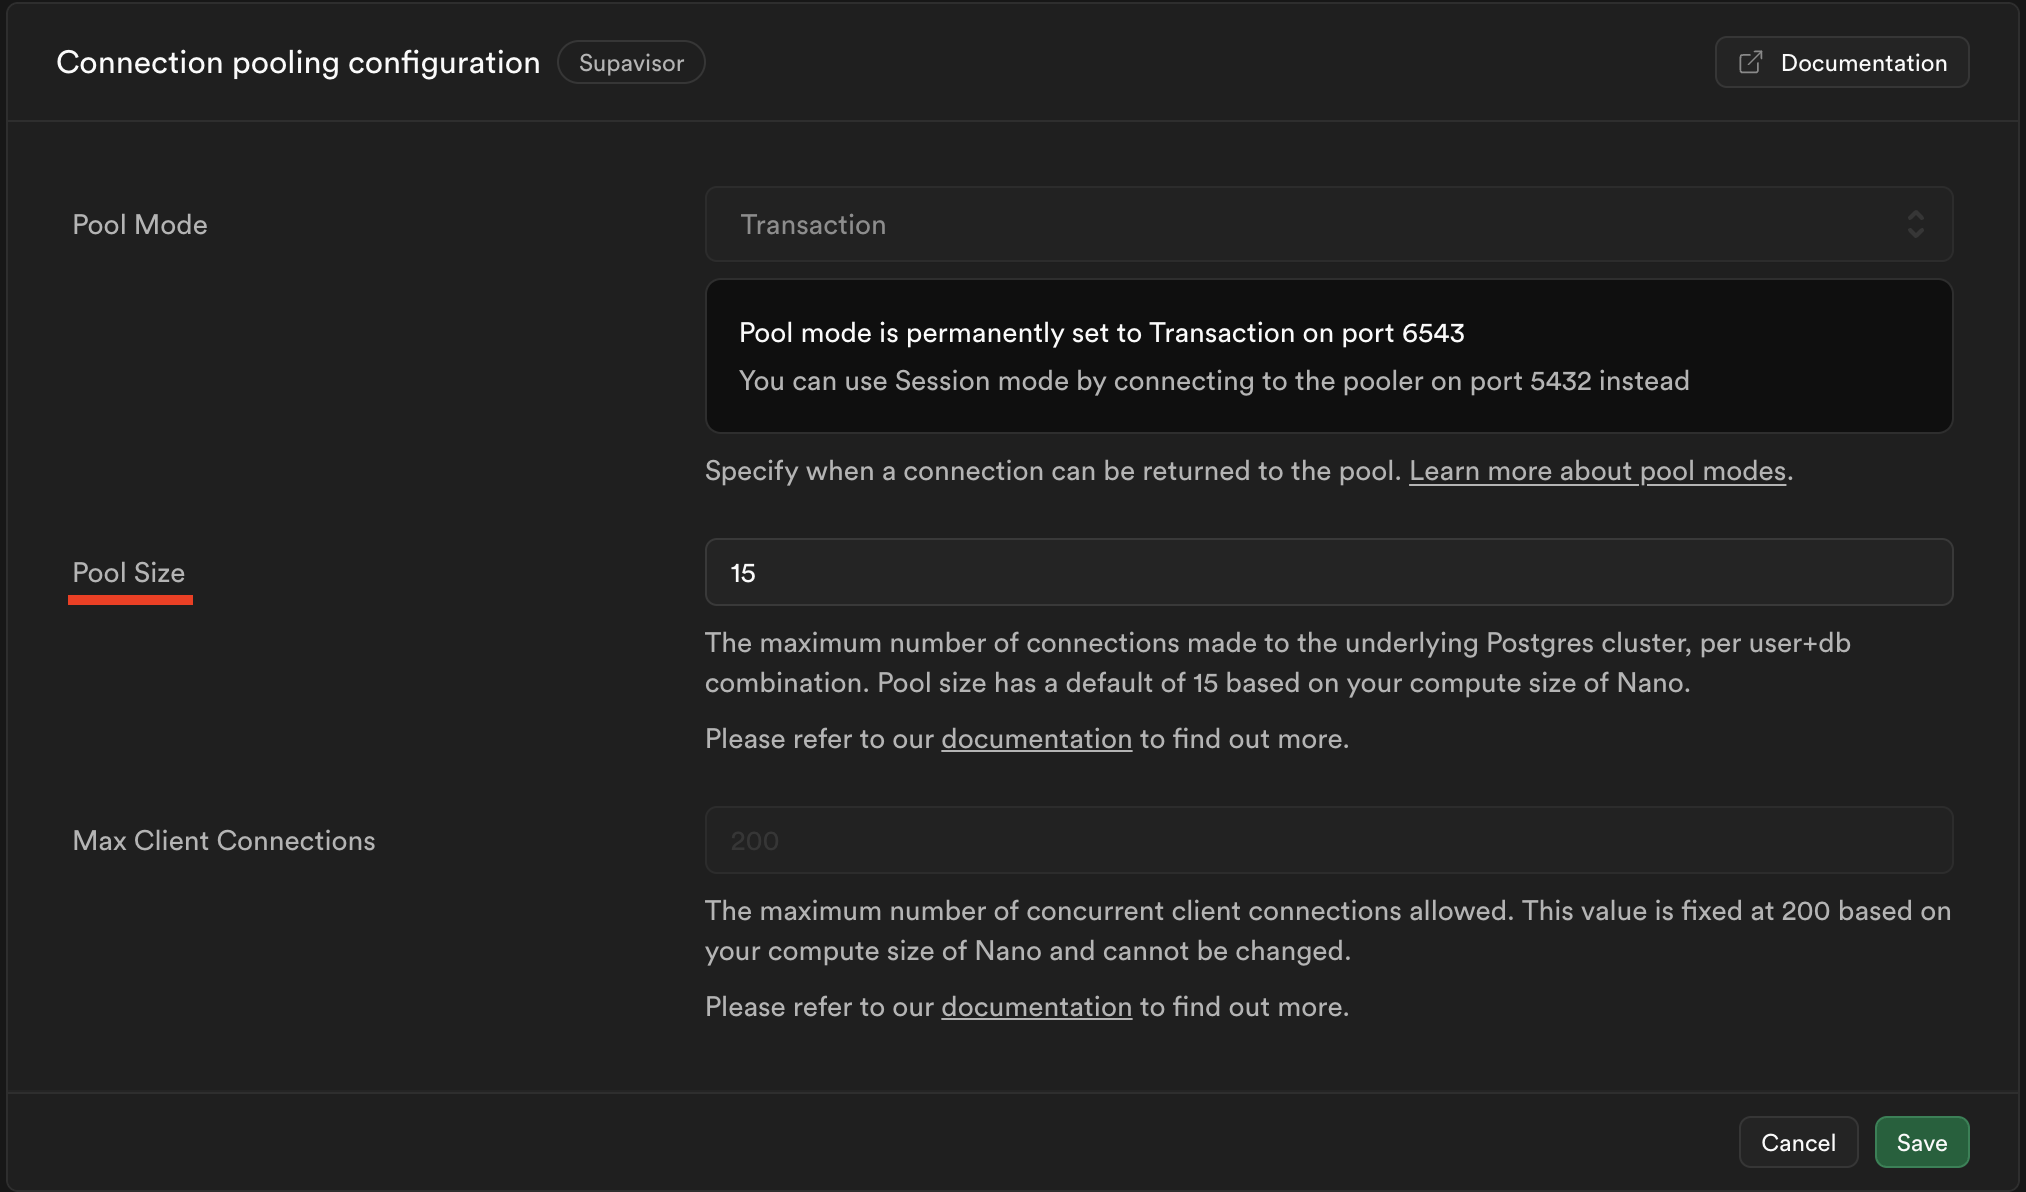
The general rule is that if you are heavily using the PostgREST database API, you should be conscientious about raising your pool size past 40%. Otherwise, you can commit 80% to the pool. This leaves adequate room for the Authentication server and other utilities.
These numbers are generalizations and depends on other Supabase products that you use and the extent of their usage. The actual values depend on your concurrent peak connection usage. For instance, if you were only using 80 connections in a week period and your database max connections is set to 500, then realistically you could allocate the difference of 420 (minus a reasonable buffer) to service more demand.
Monitoring connections
Capturing historical usage
Dashboard monitoring charts
For Teams and Enterprise plans, Supabase provides Advanced Telemetry charts directly within the Dashboard. The Database client connections chart displays historical connection data broken down by connection type:
- Postgres: Direct connections from your application
- PostgREST: Connections from the PostgREST API layer
- Reserved: Administrative connections for Supabase services
- Auth: Connections from Supabase Auth service
- Storage: Connections from Supabase Storage service
- Other roles: Miscellaneous database connections
This chart helps you monitor connection pool usage, identify connection leaks, and plan capacity. It also shows a reference line for your compute size's maximum connection limit.
For more details on using these monitoring charts, see the Reports guide.
Grafana Dashboard
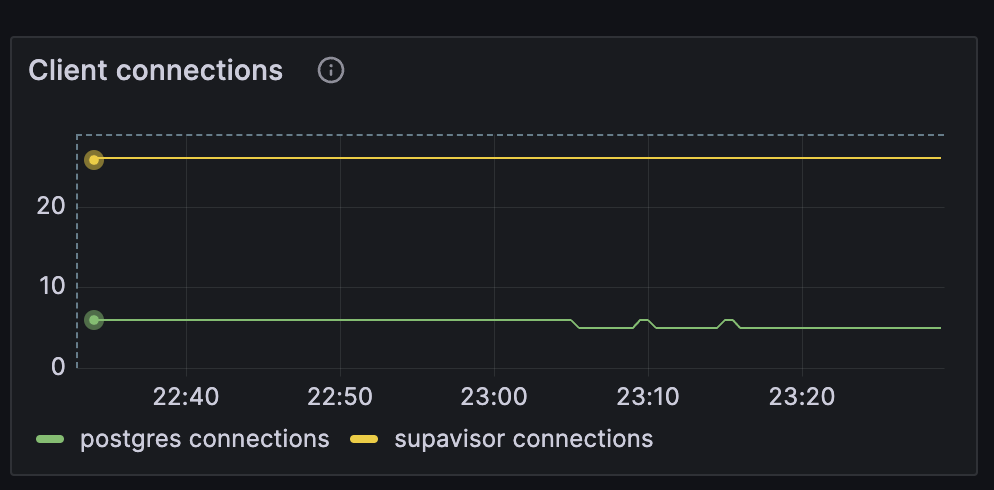
Supabase offers a Grafana Dashboard that records and visualizes over 200 project metrics, including connections. For setup instructions, check the metrics docs.
Its "Client Connections" graph displays connections for both Supavisor and Postgres
Observing live connections
pg_stat_activity is a special view that keeps track of processes being run by your database, including live connections. It's particularly useful for determining if idle clients are hogging connection slots.
Query to get all live connections:
1234567891011121314SELECT pg_stat_activity.pid as connection_id, ssl, datname as database, usename as connected_role, application_name, client_addr as IP, query, query_start, state, backend_startFROM pg_stat_sslJOIN pg_stat_activityON pg_stat_ssl.pid = pg_stat_activity.pid;Interpreting the query:
| Column | Description |
|---|---|
connection_id | connection id |
ssl | Indicates if SSL is in use |
database | Name of the connected database (usually postgres) |
usename | Role of the connected user |
application_name | Name of the connecting application |
client_addr | IP address of the connecting server |
query | Last query executed by the connection |
query_start | Time when the last query was executed |
state | Querying state: active or idle |
backend_start | Timestamp of the connection's establishment |
The username can be used to identify the source:
| Role | API/Tool |
|---|---|
supabase_admin | Used by Supabase for monitoring and by Realtime |
authenticator | Data API (PostgREST) |
supabase_auth_admin | Auth |
supabase_storage_admin | Storage |
supabase_replication_admin | Synchronizes Read Replicas |
postgres | Supabase Dashboard and External Tools (e.g., Prisma, SQLAlchemy, PSQL...) |
| Custom roles defined by user | External Tools (e.g., Prisma, SQLAlchemy, PSQL...) |